
Local weather from Jenks, Oklahoma
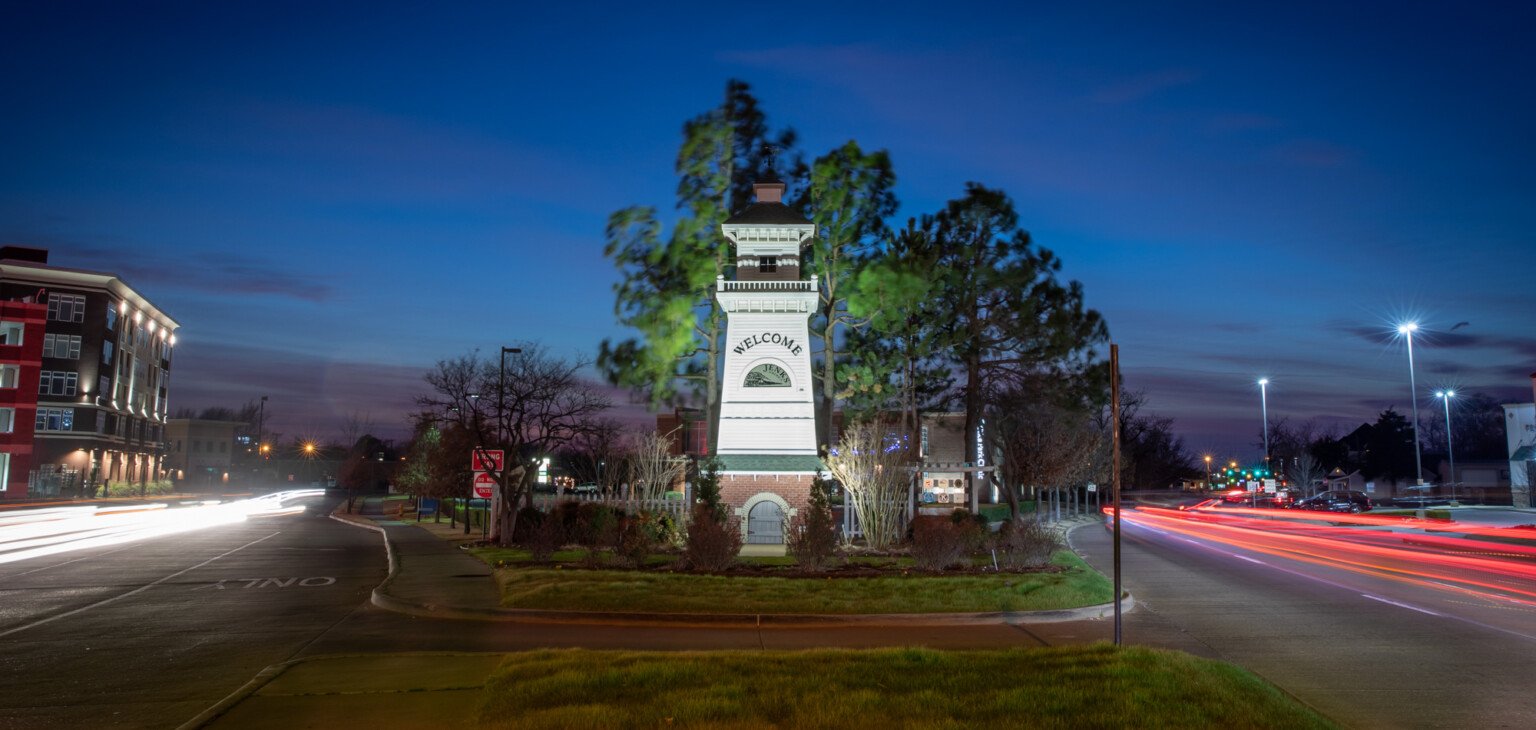
RunsLinux Weather follows conditions here in Jenks, just south of Tulsa near the Arkansas River. From summer heat and thunderstorms to winter cold fronts, this station keeps a local record of how the weather changes throughout the day and across the seasons.
Jenks is home to the Oklahoma Aquarium, the RiverWalk, and a downtown with a small-town feel. The entrance photo is a reminder of the community behind the readings: this is a personal weather station sharing a view of the weather where we live.
The dashboard brings together outdoor weather observations, soil measurements, historical graphs, and regional forecast information. The measurements describe conditions around the station; nearby neighborhoods can experience different rainfall, winds, and temperatures.
The main station: WeatherFlow Tempest
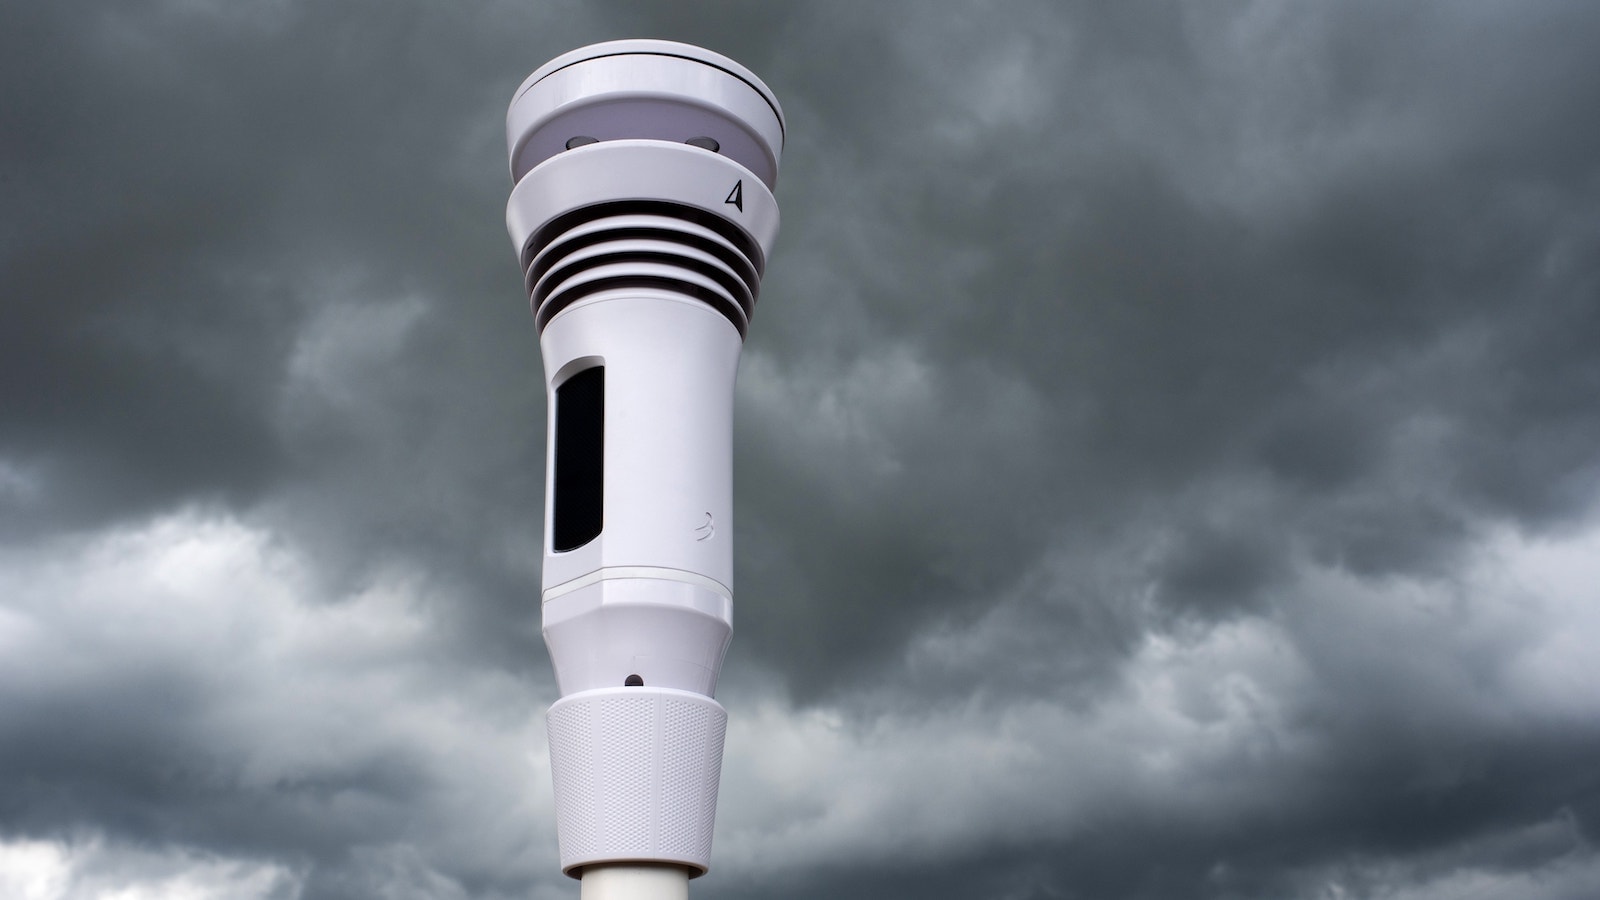
The WeatherFlow Tempest supplies the main outdoor observations. Its integrated sensors measure air temperature, relative humidity, atmospheric pressure, wind speed and direction, rainfall, ultraviolet intensity, and solar radiation. It also detects nearby lightning activity and estimates its distance.
Wind is measured using ultrasonic pulses rather than spinning cups. The rain sensor detects the impacts of raindrops, allowing the station to report rainfall accumulation and intensity without a tipping bucket. Solar panels replenish the device’s rechargeable battery.
Those observations support familiar derived readings such as dew point, heat index, wind chill, and “feels like” temperature. These calculated values add context to the measurements; they are not separate physical sensors.
On this site, the Tempest data appears in live readings and charts for temperature, wind and gusts, rain, pressure, lightning, UV, and solar radiation. Regional radar, forecasts, and weather alerts provide a wider view alongside the station’s own observations.
Soil monitoring around the property
Ecowitt soil monitoring adds a view below ground. Four soil-moisture channels follow conditions in the garden, front bed, back bed, and front yard. Comparing these areas makes it easier to see how rainfall, irrigation, shade, and soil conditions affect different parts of the property.
| Measurement | Coverage | What it shows |
|---|---|---|
| Soil moisture | Garden, front bed, back bed, front yard | Moisture readings expressed as a percentage; useful for tracking changes within each location. |
| Soil temperature | Front yard | Ground temperature in degrees Fahrenheit, alongside the outdoor air-temperature record. |
| Soil conductivity | Front yard | Electrical conductivity in µS/cm. Changes can reflect soil moisture and dissolved salts; this is not a direct fertilizer or nutrient test. |
The front-yard temperature and conductivity readings are also passed through Home Assistant and MQTT into the weather archive. Their graphs extend the moisture readings with more detail about conditions in that part of the yard.
How the site comes together
A Raspberry Pi 5 runs WeeWX to collect and archive the observations. The Belchertown skin turns that record into this dashboard and its interactive charts, while MQTT supplies live updates and Caddy serves the website.
The annual temperature-range charts show each recorded day’s low and high. Comparing years helps reveal seasonal patterns, cold spells, heat waves, and differences in the daily temperature swing. Missing observations remain gaps, and a year still in progress ends at the latest recorded day.
The Tux backgrounds change with available current conditions, and the sun and moon controls let you choose a light or dark dashboard. This is a personal station and an ongoing Linux project, built to make the local weather record useful and enjoyable to explore.